Call Us Toll Free:
1-855-430-7753

More pedestrians are being killed in car crashes than in previous decades, causing researchers to predict the largest increase in pedestrian deaths ever recorded for the past year.
Here is some sobering pedestrian safety data culled from the Governors Highway Safety Administration (GHSA):
"We are projecting the largest year-to-year increase in pedestrian fatalities since national records have been kept, and therefore we are quite alarmed," said Richard Retting, a co-author of the GHSA pedestrian safety report. "Pedestrian safety is clearly a growing problem across the country.”
Year |
Pedestrian Fatalities |
Total Traffic Fatalities | Pedestrian Deaths as a Percent of Total Traffic Fatalities |
2005 | 4,892 | 43,510 | 11% |
2006 | 4,795 | 42,708 | 11% |
2007 | 4,699 | 41,259 | 11% |
2008 | 4,414 | 37,423 | 12% |
2009 | 4,109 | 33,883 | 12% |
2010 | 4,302 | 32,999 | 13% |
2011 | 4,457 | 32,479 | 14% |
2012 | 4,818 | 33,782 | 14% |
2013 | 4,735 | 32,719 | 14% |
2014 | 4,884 | 32,675 | 15% |
*Source: FARS/GHSA
Children and the elderly comprise the majority of pedestrian deaths. However, children ages 5 to 9 (5%) and 10 to 14 years old (5%) had the highest percentages of estimated pedestrians injured among the different age categories in the chart below.
Age Group (Years) | Total Killed | Pedestrians Killed | Percentage of Total Killed |
<5 | 340 | 76 | 22% |
5–9 | 350 | 66 | 19% |
10–14 | 380 | 65 | 17% |
Children (≤ 14) | 1,070 | 207 | 19% |
15-19 | 2,425 | 226 | 9% |
20-24 | 4,047 | 405 | 10% |
25–29 | 3,250 | 340 | 10% |
30–34 | 2,567 | 358 | 14% |
35–39 | 2,155 | 297 | 14% |
40–44 | 2,067 | 329 | 16% |
45–49 | 2,196 | 360 | 16% |
50–54 | 2,712 | 481 | 18% |
55–59 | 2,414 | 461 | 19% |
60–64 | 1,976 | 390 | 20% |
65–69 | 1,517 | 253 | 17% |
70–74 | 1,228 | 226 | 18% |
75–79 | 1,107 | 197 | 18% |
80+ | 1,857 | 303 | 16% |
Seniors (65+) | 5,709 | 979 | 17% |
Total* | 32,675 | 4,884 | 15% |
Age Group (Years) | Total Injured | Pedestrians Injured | Percentage of Total Injured† |
<5 | 47,000 | 1,000 | 3% |
5–9 | 54,000 | 3,000 | 5% |
10–14 | 66,000 | 4,000 | 5% |
Children (≤ 14) | 167,000 | 8,000 | 5% |
15-19 | 229,000 | 8,000 | 3% |
20-24 | 306,000 | 7,000 | 2% |
25–29 | 252,000 | 6,000 | 2% |
30–34 | 208,000 | 5,000 | 2% |
35–39 | 170,000 | 3,000 | 2% |
40–44 | 177,000 | 4,000 | 2% |
45–49 | 172,000 | 4,000 | 2% |
50–54 | 172,000 | 5,000 | 3% |
55–59 | 148,000 | 6,000 | 4% |
60–64 | 115,000 | 3,000 | 3% |
65–69 | 81,000 | 3,000 | 3% |
70–74 | 56,000 | 2,000 | 3% |
75–79 | 39,000 | 1,000 | 3% |
80+ | 44,000 | 2,000 | 4% |
Seniors (65+) | 221,000 | 7,000 | 3% |
Total | 2,338,000 | 65,000 | 3% |
Sources: FARS 2014 ARF and National Automotive Sampling System (NASS) General Estimates System (GES) 2014.
*Fatality totals include 87 total fatalities and 51 pedestrian fatalities of unknown age.
† Percentages of total injured were calculated using total injured and pedestrians injured estimates before rounding.
Note: Injured totals may not equal sum of components due to independent rounding. Latest data available, published May 2016, by National Highway Safety Association.
To understand this troubling trend, let’s see how it is playing out across the country, as well as what is causing it.
To show the relative safety of pedestrians across the nation, the “Dangerous by Design 2014” report by Smart Growth America and the National Complete Streets Coalition uses a “Pedestrian Danger Index” (PDI). Of course, cities where people walk more have more pedestrian deaths, so the index plots the number of pedestrians who die against the number of people who walk.
Here are the most dangerous cities for walkers:
Rank |
Metropolitan area | Total pedestrian deaths (2003– 2012) | Annual pedestrian deaths per 100,000 (2008– 2012) | Percent of people commuting by foot (2008–2012) | Pedestrian Danger Index (2008– 2012) |
1 | Orlando-Kissimmee, FL | 583 | 2.75 | 1.1 | 244.28 |
2 | Tampa-St. Petersburg- Clearwater, FL | 874 | 2.97 | 1.6 | 190.13 |
3 | Jacksonville, FL | 359 | 2.48 | 1.4 | 182.71 |
4 | Miami-Fort Lauderdale-Pompano Beach, FL | 1,539 | 2.58 | 1.8 | 145.33 |
5 | Memphis, TN-MS-AR | 239 | 1.72 | 1.3 | 131.26 |
6 | Birmingham-Hoover, AL* | 148 | 1.33 | 1.1 | 125.60 |
7 | Houston-Sugar Land-Baytown, TX | 1,034 | 1.70 | 1.4 | 119.64 |
8 | Atlanta-Sandy Springs-Marietta, GA | 839 | 1.59 | 1.3 | 119.35 |
9 | Phoenix-Mesa-Scottsdale, AZ | 840 | 1.86 | 1.6 | 118.64 |
10 | Charlotte-Gastonia-Concord, NC-SC | 254 | 1.65 | 1.5 | 111.74 |
11 | Detroit-Warren-Livonia, MI | 713 | 1.55 | 1.4 | 111.63 |
12 | Dallas-Fort Worth-Arlington, TX | 900 | 1.31 | 1.2 | 107.54 |
13 | Las Vegas-Paradise, NV | 413 | 1.85 | 1.8 | 102.67 |
14 | Riverside-San Bernardino- Ontario, CA | 889 | 1.81 | 1.8 | 102.17 |
15 | Nashville-Davidson- Murfreesboro-Franklin, TN | 210 | 1.25 | 1.2 | 100.79 |
16 | Raleigh-Cary, NC* | 165 | 1.37 | 1.4 | 100.35 |
17 | Louisville-Jefferson County, KY- IN | 200 | 1.60 | 1.6 | 98.48 |
18 | San Antonio, TX | 373 | 1.86 | 1.9 | 96.87 |
19 | Richmond, VA | 167 | 1.32 | 1.4 | 94.98 |
20 | Oklahoma City, OK | 177 | 1.43 | 1.6 | 87.16 |
21 | Kansas City, MO-KS | 228 | 1.13 | 1.3 | 85.74 |
22 | New Orleans-Metairie-Kenner, LA | 272 | 2.09 | 2.5 | 84.90 |
23 | Sacramento-Arden-Arcade- Roseville, CA | 390 | 1.66 | 2.0 | 81.27 |
24 | Austin-Round Rock, TX | 251 | 1.44 | 1.8 | 78.58 |
25 | Indianapolis-Carmel, IN | 199 | 1.16 | 1.6 | 72.98 |
26 | St. Louis, MO-IL | 364 | 1.22 | 1.7 | 69.69 |
27 | Los Angeles-Long Beach-Santa Ana, CA | 2,435 | 1.79 | 2.7 | 66.91 |
28 | Baltimore-Towson, MD | 482 | 1.78 | 2.7 | 66.42 |
Note: Metro areas marked with an asterisk (*) denote a margin of error more than 10 percent for journey-to- work data in the American Community Survey.
Traffic fatalities by state 2015 preliminary data
| State | Percentage change 2014 to 2015 |
|---|---|
| Ohio | 124% increase |
| Minnesota | 100% increase |
| Montana | 100% increase |
| Oregon | 100% increase |
| Nebraska | 80% increase |
| Missouri | 79% increase |
| West Virginia | 57% increase |
| Wisconsin | 47% increase |
| Oklahoma | 45% increase |
| District of Columbia | 40% increase |
| Delaware | 33% increase |
| South Carolina | 31% increase |
| Colorado | 30% increase |
| Washington | 28% increase |
| Massachusetts | 26% increase |
| Illinois | 24% increase |
| New York | 22% increase |
| Kentucky | 20% increase |
| Nevada | 20% increase |
| Arizona | 12% increase |
| Virginia | 9% increase |
| California | 7% increase |
| Mississippi | 7% increase |
| Indiana | 6% increase |
| Alabama | 5% increase |
| New Jersey | 4% increase |
| Texas | 1% increase |
| Maine | 0% |
| Utah | 0% |
| Wyoming | 0% |
| Tennessee | 2% decrease |
| North Carolina | 3% decrease |
| Florida | 4% decrease |
| Connecticut | 6% decrease |
| Louisiana | 6% decrease |
| Georgia | 8% decrease |
| Michigan | 9% decrease |
| Maryland | 13% decrease |
| Pennsylvania | 19% decrease |
| Iowa | 20% decrease |
| Hawaii | 24% decrease |
| New Mexico | 32% decrease |
| Arkansas | 38% decrease |
| Alaska | 50% decrease |
| Kansas | 50% decrease |
| Rhode Island | 67% decrease |
| Idaho | 71% decrease |
| North Dakota | 75% decrease |
| South Dakota | 75% decrease |
| New Hampshire | 78% decrease |
| Vermont | 100% decrease |
Many factors contribute to changes in the number pedestrian fatalities, including economic conditions,
weather conditions, fuel prices, how roads are constructed, the amount of motor vehicle travel and the amount o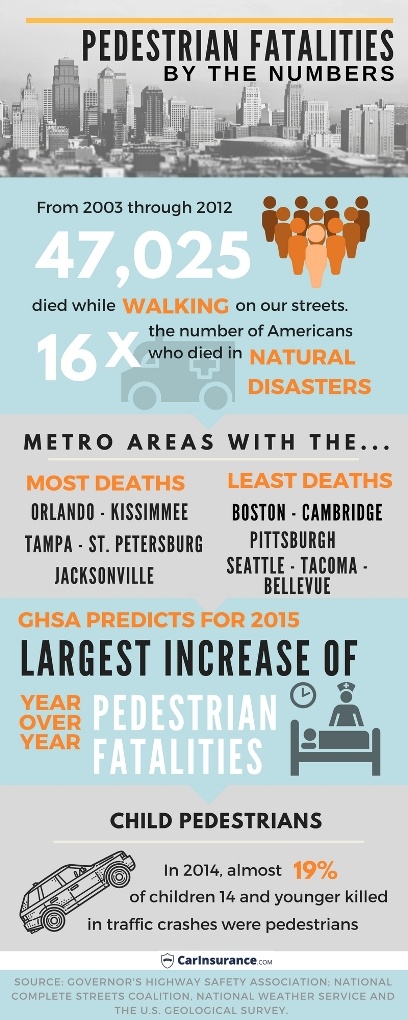 f time people spend walking, according to the GHSA and transportation researchers and engineers.
The major factors, however, fueling the higher death rate of walkers include:
As you see in the first chart above, the PDI result is bad news for Sun Belt pedestrians. Of the 20 most dangerous places to walk, only one -- Detroit -- is north of the Mason-Dixon Line. “These places grew in the post-war period, mostly through rapid spread of low-density neighborhoods that rely on wider streets with higher speeds to connect homes, shops and schools—roads that tend to be more dangerous for people walking,” says the Design by Safety report.
But aside from poor urban design, there are also more people about on foot, which boosts the chances for pedestrians to be hurt or killed:
People walking while using their cellphones is definitely becoming a more common occurrence, which contributes to more pedestrian accidents, injuries and deaths:
Hybrids are super quiet when running on just electric power, which can be dangerous for pedestrians who can’t hear them approaching, especially in areas such as parking lots.
The frequency and severity of motor vehicle-pedestrian crashes can be reduced through a broad range of approaches, including targeted traffic enforcement, engineering countermeasures, public education, and vehicle design changes. The GHSA website has examples of programs underway in all states.
If you’re hit by a car and injured: If you are hit by a car while walking, you can file a claim against the driver’s auto insurance. The bodily injury liability portion of the driver’s coverage will pay for your medical expenses up to the limit of the policy. Just like a car-to-car accident, you want to try to get the driver's information at the scene of the accident and make a police report.
If you’re hit by a car and injured and have a no-fault auto insurance policy: You must submit the claim to your own car insurance company. The personal injury protection (PIP) portion of your coverage will pay for your expenses.
If you are injured as a pedestrian by a hit-and-run driver: You must submit the claim to your own car insurance company. The uninsured motorist bodily injury portion of your policy will pay for your medical expenses (up to your limits). If you have PIP it also would pay for your injuries, up to your limits.
If the driver's auto insurance isn't enough to compensate you fully: Your underinsured motorist bodily injury coverage should cover you as a pedestrian. If you don’t have this coverage, you can use your own health insurance, as long as it doesn’t exclude injuries resulting from auto accidents. You can also opt to hire an attorney and take the matter to court. You're entitled to be "made whole" following an accident. That may include compensation for medical bills as well as pain and suffering, lost wages from work, emotional distress and property loss.
If you or a family member is hit by a car while walking and dies: If your auto policy includes PIP or medical payments (MedPay), it will cover not only you, but members of your family if struck by a vehicle while walking. If the at-fault driver of the vehicle is known and you do not live in a no-fault state, you can put a claim instead through his bodily injury liability coverage.
If you injure a pedestrian while driving: The bodily injury liability portion of your policy will cover the medical bills of the injured party, up to your limits. The harmed person can also claim lost wages and pain and suffering under your liability coverage. If your limits are exceeded, the person can come after you personally for any remaining compensation he is due.
If you kill a pedestrian while driving: The bodily injury liability portion of your policy will cover medical expenses, or if you are sued for wrongful death. The person’s PIP policy may also be used by the family.
Governors Highway Safety Association: Spotlight on Highway Safety Report/Pedestrian Fatalities by State 2015 Preliminary Data by Richard Retting and Heather Rothenberg, PhD, Sam Schwartz Consulting.
Dangerous by Design 2014/Methodology for Pedestrian Danger Index: The Pedestrian Danger Index (PDI) gives an indication of the likelihood of a person on foot being hit by a vehicle and killed. The PDI is based on the share of local commuters who walk to work—the best available measure of how many people are likely to be out walking each day—and the most recent five years of data on pedestrian fatalities. PDI is the rate of pedestrian deaths relative to the number of people who walk to work in the region. The PDI is calculated by dividing the average annual fatality rate for a metro area by the percentage of commuters walking to work in that metro area. It is from the “Dangerous by Design” 2014 report, conducted by Smart Growth America and the national Complete Streets Coalition.
Smart Growth America is a national organization dedicated to researching, advocating for and leading coalitions to bring better development to more communities nationwide.
The National Complete Streets Coalition seeks to fundamentally transform the look, feel and function of the roads and streets in our communities, by changing the way most roads are planned, designed and constructed.
Comments
Tell us your thoughts